Automating Supply Chain Forecasting

How AI freed $24.7M in working capital while improving service levels to 96.8%

WINTER 2025

The first clue wasn't glamorous. Pallets stacking higher than prudence in a Midwestern distribution center. Safety stock bloating like a stubborn balloon. While this happened, bestseller SKUs trickled into stockouts—angry customers, scattered substitutions, and the bitter aftertaste of lost revenue. Sound familiar? Good. Because that mess—equal parts spreadsheet roulette and gut feel—became the forcing function for a blunt experiment: automate supply chain forecasting with AI, from data ingestion to demand sensing to replenishment triggers. The outcome: freed cash, faster turns, fewer apologies.

This is a real-world story, not a glossy vendor deck. We'll walk through the data chaos, the models that finally behaved, the change management that almost killed the program (twice), and the metrics that matter when your CFO asks, "So where's the money?" If you've ever been caught between planners pleading for buffer and sales screaming for fill rate, pull up a chair.

"The real gold sits on the balance sheet: inventory that doesn't need to exist."

One more thing before we dig in. We'll talk about revenue, yes. But the real gold sits on the balance sheet: inventory that doesn't need to exist. Free that, and you'll feel it in working capital, carrying costs, and the possibility of funding growth without begging the bank.

Baseline: From Spreadsheet Heroics to AI Demand Signal

The company: a $420M specialty consumer goods brand with seasonal variability, influencer-driven demand spikes, and a complex SKU portfolio (22,000 active, half with intermittent demand). Forecasts were stitched from two tools and seven opinions. The result: 78% forecast accuracy at the SKU-week level and a bullwhip effect that would make a metronome dizzy. Supplier MOQs and long ocean lead times did the rest.

The objective was deceptively simple: reach 88–90% weekly SKU accuracy for A and B items, hold service at 96%+, and pull $18–22M out of inventory within 12 months—without kneecapping growth. To get there, the team needed an always-on, multi-signal forecast: historicals, price elasticity, promo calendars, social buzz, retailer POS, and weather (because hurricanes and heaters, obviously).

Data Pipeline Architecture

They built a pipeline that stitched together ERP orders, WMS inventory snapshots, e-commerce clickstreams, and retailer POS feeds. Then the fun part: weak signals. Social media marketing chatter (especially short-form video mentions) correlated with lift on 14 hero SKUs. Search impressions predicted traffic two to three weeks out. Email cadence from content marketing nudged steady-state demand.

Model selection wasn't religious. They ran a tournament: gradient-boosted trees, probabilistic ensembles, temporal convolutional networks, intermittent-demand models (Croston's with Bayesian updates), and hybrid causal graphs for promo periods. Winner-take-most by SKU cluster. Crucially, they didn't chase elegance—they chased stability under data drift.

The Build: From Forecast to Action

A forecast is cute. Replenishment is rent money. The team wired the model outputs to policy: safety stock recalculation by service class; vendor calendars aligned to new order cadence; automated purchase order proposals gated by planners. Think of it as marketing automation for supply chain—logic, triggers, and guardrails—without the spam.

Controls mattered. Every recommended PO came with reason codes: "Lead time variance spike," "Promo uplift probability 0.72," "Elasticity adjustment from 1.18 to 0.94." When you ask professionals to trust a black box, you'd better hand them a flashlight. A weekly huddle reviewed exceptions where uncertainty bands widened past thresholds. And yes, humans overruled the machine roughly 15% of the time in months one to three. By month nine, that fell below 6%.

"When you ask professionals to trust a black box, you'd better hand them a flashlight."

Two integrations changed the game. First, retailer POS arrived daily, enabling near-real-time demand sensing. Second, a price API pushed elasticity estimates into the model after every promo. Classic gotcha: when the price team cut too deep, demand spikes evaporated post-promo faster than the model learned. They fixed it by feeding post-event decay curves—like teaching a dog not only to fetch but to drop the ball.

And because leadership wanted proof beyond anecdotes, the team bracketed shadow P&L tracking: carrying cost at 18% blended, expediting penalties, margin dilution from stockout-driven substitutions, and the ugly cost of "panic air." Automating the forecast was never just about pretty graphs; it was about cash discipline.

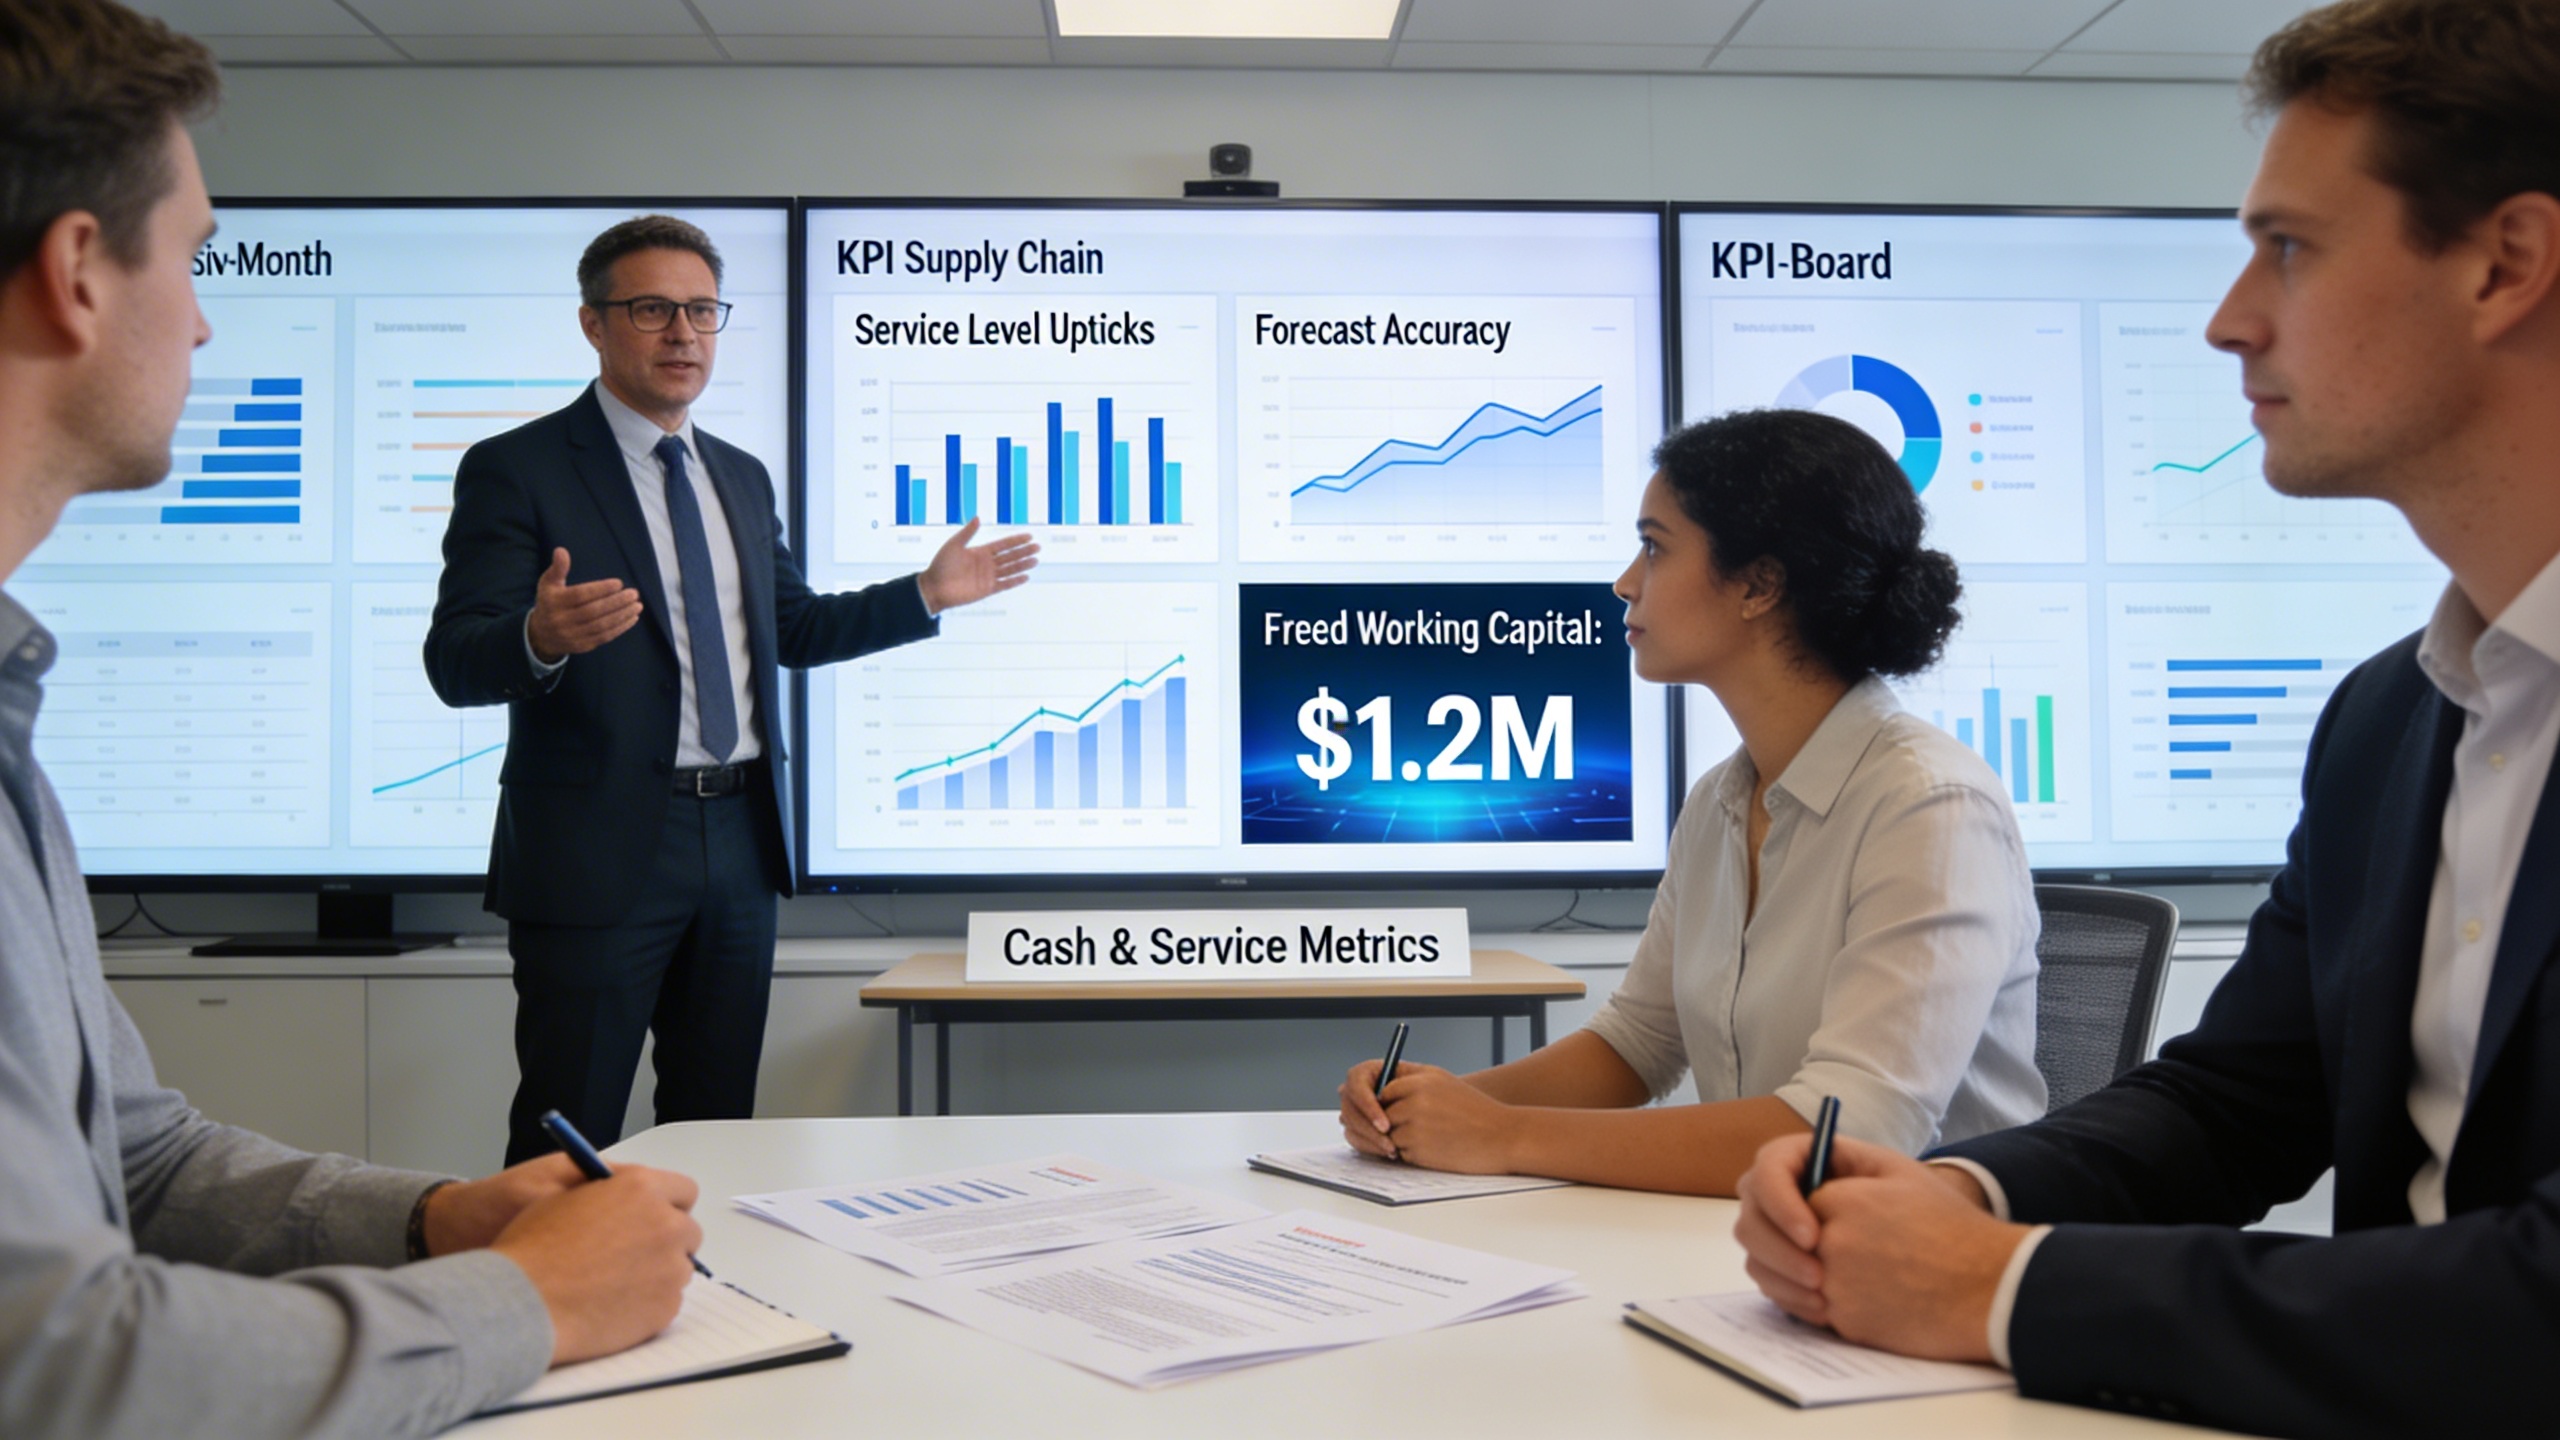
Executive presenting KPI improvements and freed working capital, highlighting content marketing of measurable business results and SEO optimization of metrics

Results: Cash Unlocked, Revenue Protected

Ninety days in, planners stopped rolling their eyes. Service level for A items ticked from 95.2% to 97.1%. Not fireworks, but fewer angry calls. At six months: A and B SKUs at 96.8% service, forecast accuracy at 89.4% on the weekly horizon, with promo weeks holding up at 85% (a minor miracle given their past chaos). Stockouts on the top 200 SKUs dropped 31%. And the DC looked less like a Costco overflow lot.

The CFO perked up when inventory turns climbed from 4.6 to 6.1. That's where the cash showed up. With $210M average inventory, the program freed $24.7M in working capital by month ten. Carrying costs fell by roughly $3.8M annualized. Expediting spend was cut in half. While this happened, net revenue rose 3.4% year over year, buoyed by fewer lost sales and smarter allocations to retail regions with real demand, not wishful thinking.

Financial Impact Summary

  • Inventory turns: 4.6 → 6.1
  • Working capital freed: $24.7M
  • Carrying costs reduced: $3.8M annually
  • Expediting spend: Cut in half
  • Net revenue growth: 3.4% YoY

What about marketing? Weirdly (or not), the forecast's weak signals pushed the content strategy team to coordinate launches around forecastable lift windows. Social spikes weren't random anymore; they were harnessed. Campaigns moved from shouting to sensing. This is where leaders on Joe's Site would nod—SEO optimization and social signals quietly sharpen demand planning when they're connected, not siloed.

ROI? Payback in 7.5 months on a $3.2M program (data engineering, MLOps, vendor tooling, change management). Not unicorn math—just cleaner demand visibility, tighter inventory policy, and planners empowered by agents that never sleep.

"Social spikes weren't random anymore; they were harnessed."

How They Did It: Architecture, Agents, and the Messy Middle

Data foundation that didn't crumble

They built a lakehouse with three sanctuaries: bronze for raw streams (ERP, WMS, POS, marketing automation logs), silver for conformed tables, gold for model-ready features. Daily backfills, late-binding joins for retailer feeds, and a simple rule: every feature had an owner and a documented drift policy. When seasonality shifted, so did the features. No heroics, just process.

Model governance without bureaucracy

Forecasts shipped as probabilistic distributions, not single points. Planners saw P50 for typical orders, P80 for safety stock, and P95 during promos and long-lead imports. Champion-challenger monitoring ran monthly. If the challenger consistently beat the champion by 2+ points over four weeks, it took the crown. Human sign-off stayed required—but perfunctory once trust formed.

Agentic automation—useful, not cute

Three lightweight agents earned their keep: a data watchdog that flagged anomalies in lead times and MOQ changes; a promo whisperer that translated calendar changes into elasticity updates; and a replenishment scribe that drafted PO proposals with cited sources. The watchdog caught a stealth supplier de-commit on packaging that would've cratered a holiday run. Saved seven figures in scramble costs. Quiet hero.

Change management where the plot almost unraveled

The first pilot launch cratered because the training deck read like a PhD thesis. They rewrote it with examples, bad weeks dissected, and a blunt rulebook for overrides. Planners practiced on a sandbox sim—historical weeks, live tools, no consequences. Trust isn't a keynote; it's reps.

What they didn't do (and you shouldn't either)

  • They didn't turn off human overrides. Ever.
  • They didn't forecast every last SKU. C items got reorder curves and min-max policy, not opera.
  • They didn't chase perfect accuracy. They chased profitable accuracy—service targets met with less stuff.
  • They didn't launch without supplier alignment. Vendors saw the cadence changes first to avoid whiplash.

Playbook: Step-by-Step Moves You Can Actually Run

Here's the blunt, field-tested sequence. No mysticism, just order of operations that prevents rework and political heartburn.

  1. Define money metrics. Target inventory turns, cash freed, and service thresholds by class. Brand these metrics. Put them on TV screens. People optimize what they see.
  2. Prioritize SKU classes. A/B get probabilistic forecasts; C gets policy. Intermittent demand gets its own lane. Stop pretending all items deserve sonnets.
  3. Wire weak signals. Bring in retailer POS, search trend indices, and social engagement lift (even from content marketing pushes). Test against holdouts before you believe the hype.
  4. Create transparent PO proposals. Every recommendation cites which signals moved and by how much. Remove the "trust me" vibe.
  5. Pilot on one DC and two categories. Demand variability plus seasonality. If it works there, it'll work anywhere.
  6. Institute weekly exception reviews. Focus on wide-interval items and promo weeks. Praise correct overrides loudly.
  7. Negotiate supplier calendars to match rhythms. Smaller, steadier orders beat once-a-month truckloads that miss reality.
  8. Track four costs religiously: carrying, expediting, markdowns, and lost sales. Celebrate turn gains, not just forecast "points."

You'll need a small strike team: a data engineer who respects dull reliability, a data scientist who loves residual plots, a planner with scar tissue, and a program lead who can say "no" to scope creep. Toss in a marketer who can translate social and SEO optimization signals into structured data. Now you're dangerous.

The Bottom Line

Automated forecasting doesn't eliminate judgment. It eliminates avoidable surprises. You'll free cash, steady service, and finally treat inventory like the strategic asset it is—not a hostage to old habits. Build the pipes, respect the signals, keep humans in the loop, and measure the money. That's the work. And yes, the DC will breathe again.